
📐 All Your Models Will Be Destroyed
FIRE BTC Issue #71 - The Power Law, your FIRE plan, and why being directionally correct beats being precisely wrong

"All your models will be destroyed."
That's Michael Saylor's Rule #12 from his 21 Rules of Bitcoin keynote at BTC Prague in 2024, and it might be the most useful thing he's ever said about the asset. Every framework we've used to project bitcoin's future price — Stock-to-Flow, rainbow charts, four-year cycle maps — has eventually been humbled by the market. The models don't survive. The question is whether they were useful before they broke.
I can tell you from personal experience that they can be.
Back in 2019 and 2020, Stock-to-Flow was the dominant model in bitcoin. PlanB's framework argued that bitcoin's halving-driven scarcity would produce predictable price increases, and while I wasn't a true believer, the logic was compelling enough to change my behavior. I stacked significantly more sats during that period than I would have otherwise. The model came under heavy criticism in the last few years, as PlanB's predictions fell short. If you look at the S2F chart over the last few years, cracks are showing. For most of bitcoin's history, the price tracked above the S2F line. Since 2022, it has spent more time below it than above it, and the divergence has been growing. S2F implies exponential growth forever, with each halving producing higher and higher peaks, and there's no mechanism built in for the kind of deceleration you'd expect from a maturing network. That structural weakness is becoming harder to ignore.

However, the sats I accumulated because of it are worth considerably more today than when I bought them.
So what do you do when you know models break, but you also know they can be useful? That's the question this article is about, and it's why I just built something into the FIRE BTC Compass that a lot of you have been asking for.
🎯 Your Growth Assumption Is Made Up
Every FIRE calculator asks you to plug in a growth rate for your portfolio. If you're using bitcoin as your primary savings vehicle, you probably picked something between 20% and 30% because it felt reasonable. Maybe you back-tested it against BTC's historical CAGR, or maybe someone on X said 25% was conservative. Either way, you plugged in a flat annual rate and let the math compound it forward indefinitely.
I've done the same thing. The Compass originally shipped with a flat 25% default, and I've used that assumption in my own planning for years. It's a reasonable starting point, but I've always known it was a simplification, and I've been looking for something more grounded.
There's a problem with that: bitcoin is not going to compound at 25% annually until the heat death of the universe. At a 25% CAGR, a single bitcoin would be worth over $132 million by 2060. Could hyperinflation technically produce that dollar number? Sure, but that doesn't tell you anything about purchasing power, which is what a FIRE plan actually depends on. The dollar figure is meaningless without knowing what it buys.
But what do you replace it with? You need some number to plan around. The question is whether you pick one that has a methodology behind it, or one you made up in the shower.
Traditional FIRE planners do the same thing. They assume historical stock market returns will continue, roughly 8-10% nominal for the S&P 500, and project that forward forever. They're not predicting the future; they're extrapolating the past and assuming the pattern holds. Bitcoin doesn't give us a century of data to extrapolate from, which means the range of plausible outcomes is wider and the need for a grounded growth assumption is that much greater.
📊 A Better Wrong Answer?
Giovanni Santostasi is an astrophysicist who applied a physics framework to bitcoin's price history in 2018. His work, known as the Bitcoin Power Law Theory, fits a power law regression to BTC's price as a function of days since the genesis block on January 3, 2009.

The basic idea is that bitcoin's price grows proportionally to a power of time — not at a constant percentage each year, but in a way where the growth is baked into the relationship between price and how long the network has existed. As the network ages, price continues to rise, but the rate of that increase gradually slows. It's the mathematical signature of a maturing system: early adoption is explosive, and doubling the user base from 100 million to 200 million is a much heavier lift than doubling it from 1 million to 2 million, even though the network is more accessible than ever.
How well does the model fit? Across 15+ years of data, from $0.10 to over $100,000, through multiple boom-and-bust cycles, the power law accounts for about 96% of bitcoin's historical price movement. In practical terms, it implies roughly 39% annual growth in 2026, declining to about 31% by 2030, and settling around 15% by 2050. If you've spent time around network effects or technology adoption curves, that trajectory makes sense — early adoption is explosive and cools as the base grows larger. As it relates to FIRE, your earliest years of stacking deliver the biggest percentage returns.
The power law doesn't share S2F's fatal flaw: it inherently models deceleration. S2F projected an exponential moonshot that never materialized because 40% annual growth can't last forever. The power law bakes that in from the start. Santostasi has also been transparent about his falsification criteria and has stated clearly what would invalidate the model, which gives it more intellectual honesty than S2F had.
That said, the critics have reasonable points. Adrian Morris has called the model a "horoscope" and argues that Santostasi is overfitting historical data to create the illusion of predictability. The core of his argument is that bitcoin's price is driven by human behavior — ETF flows, regulation, market psychology — and fitting a physics-style regression to that data can look impressive without actually predicting anything. When the model's price range for 2045 spans $200K to $10M, the critics have a point about precision. I take these criticisms seriously.
For those who want a more rigorous version, Plan C's Quantile Model uses the same underlying power law relationship but produces probabilistic bands instead of a single line — a more honest way to express the uncertainty. Instead of saying "bitcoin will be at $X," it says "there's a 70% chance bitcoin will be above $X by year Y."
One concept you'll hear in power law discussions is the "floor," and it's worth understanding what it actually means before you see it thrown around on X without context. The "floor" is the lower bound of the regression's confidence band: it represents the statistical lower edge of the historical price distribution on the log-log scale. It's not a hard support level in any engineering sense, but historically, when bitcoin's price has touched this floor, it has coincided with cycle lows and strong accumulation zones. Price has never sustained below it for long before recovering.
As I write this, bitcoin is trading around $67,000, which puts it near the power law floor and means the model is being stress-tested in real time. If you're planning your FIRE timeline, being near the floor means you're accumulating at prices that are historically cheap relative to the model's fair value estimate, and that has asymmetric upside implications for your plan.
🧭 Why I Built It Into the Compass Anyway
So if I'm skeptical, why did I add a power law toggle to the Compass?

I added it for two reasons. First, a lot of you asked for it. The power law has a lot of believers right now (probably because it hasn't yet been invalidated), and this was one of the most requested features since I launched the tool. Second, I needed something better than a flat rate for anyone who wanted it, and this is the least arbitrary option I could find.
The BTC Growth toggle in the Compass settings is a calibration tool. It shows what your FIRE plan looks like under different growth assumptions so you can stress-test your own numbers. If you think the power law is a reasonable framework, toggle it on and run your projections. If you prefer the simplicity of a flat CAGR, keep using that. The flat rate mirrors what the traditional FIRE community uses for stocks: it assumes ongoing exponential growth at a steady rate, which is also an average that doesn't tell you the path the market will take to get there. The two approaches aren't that different in spirit.
The power law doesn't need to be exactly right to be useful. Decelerating growth is probably a better assumption than constant growth for a maturing network, and this is the least arbitrary way to model that deceleration. Nobody knows whether bitcoin's annual growth will settle at 15% in 2050 or keep declining from there — the model gives us a curve, not a guarantee. Like the flat CAGR, it's a tool for thinking about the future, not a prophecy.
To make this concrete, I ran a 30-year comparison. Take $10,000 and grow it under two scenarios: the power law model (using the Compass's default parameters) versus a flat 25% CAGR:
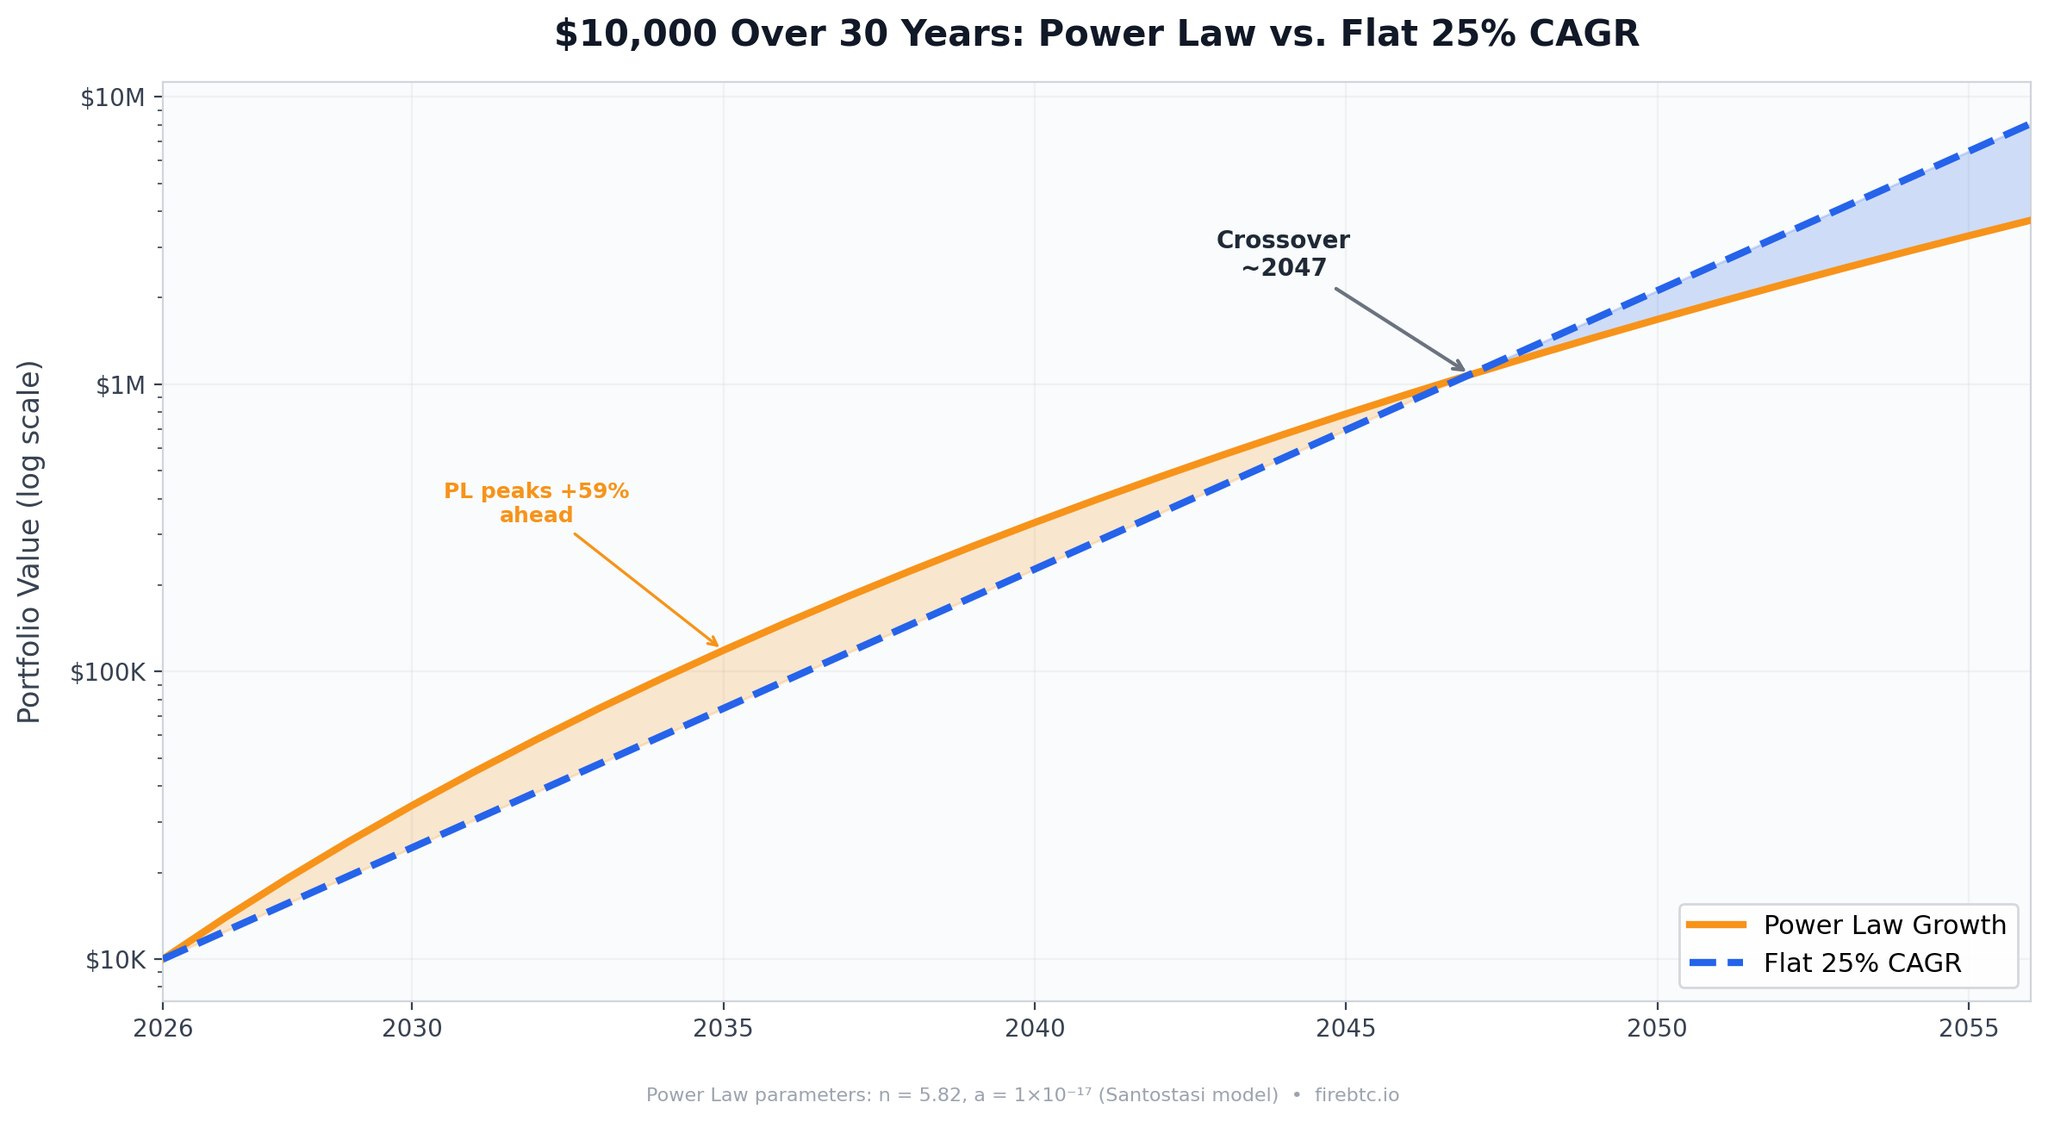
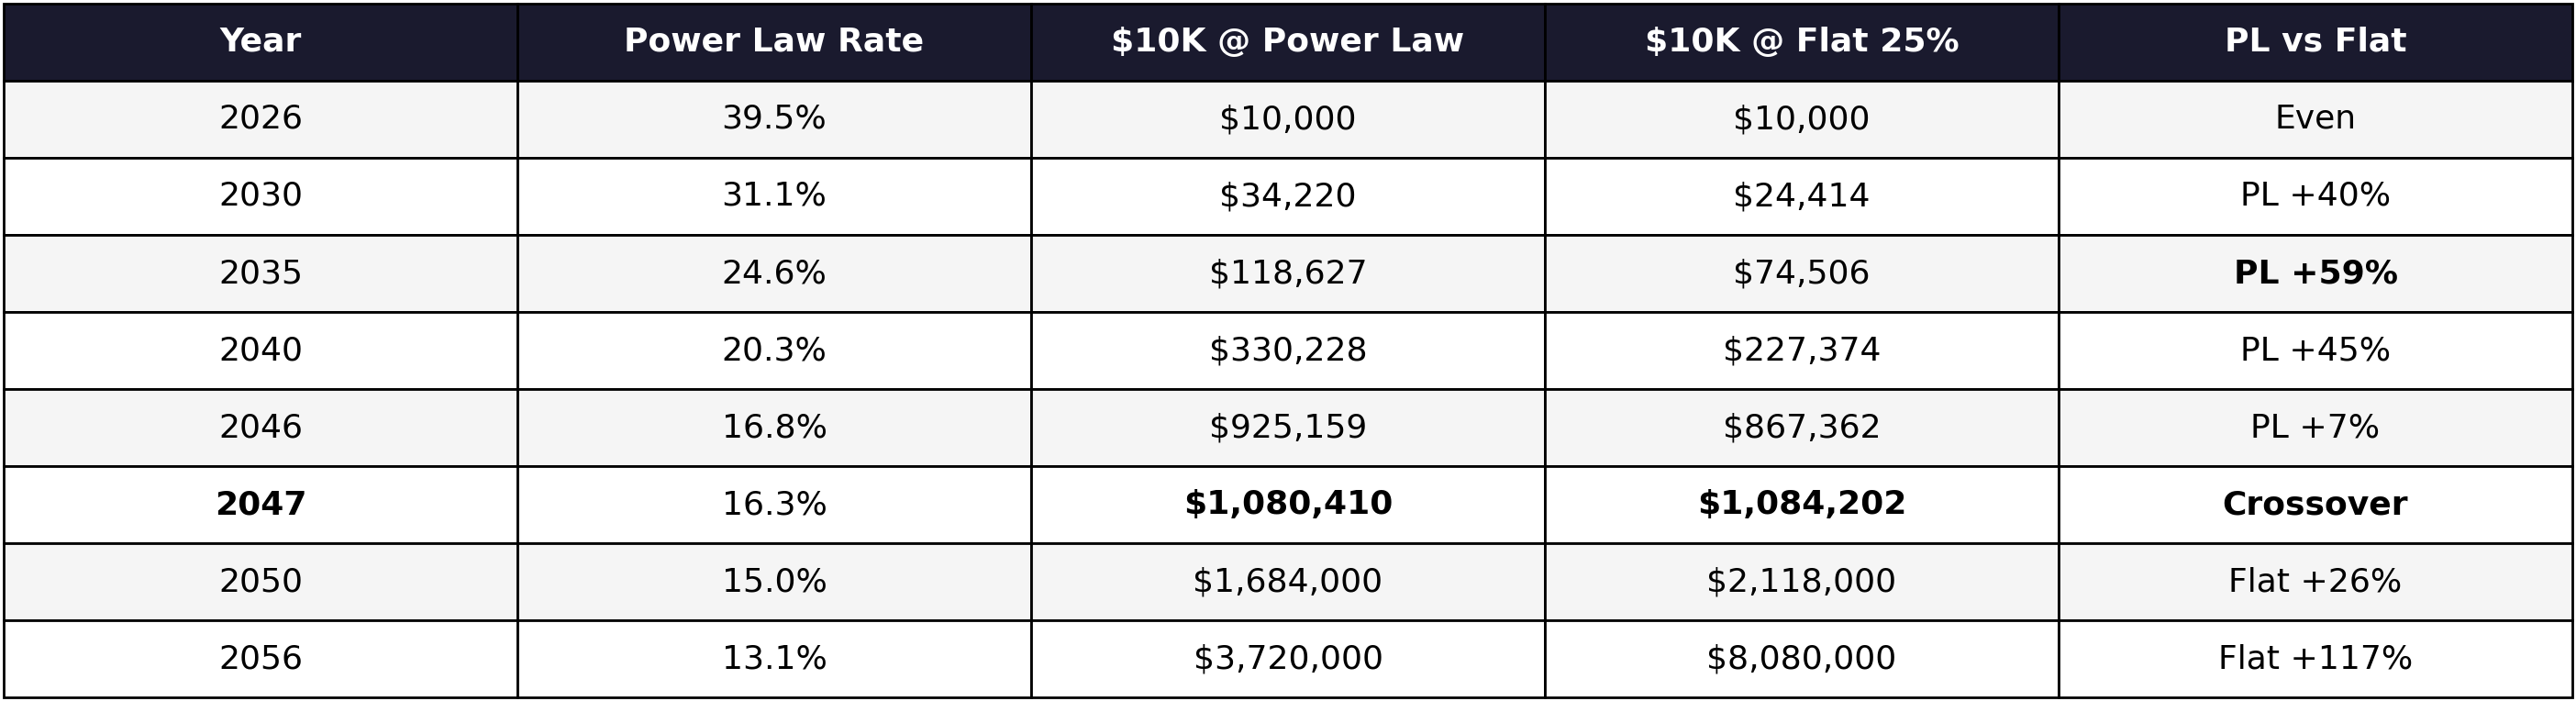
The power law starts hotter — nearly 40% in 2026 versus 25% flat — and peaks at roughly 59% ahead of the flat assumption around 2035. Then it decelerates, the gap narrows, and by 2047 the flat 25% CAGR catches up entirely. After that, the flat assumption pulls ahead because it never slows down.
What does this mean for your FIRE plan? That depends on your timeline.
