
📊 Your Cost Basis Is Not the Chart
FIRE BTC Issue #66 — Why DCA investors live in a completely different reality than chart-watchers

A reader commented last week that bitcoin went from $57,000 five years ago to $67,000 today — about 18% total. He asked what I was so excited about.
On the pure math of that comparison, he's right. Someone who bought bitcoin at the February 2021 peak of $57,000 and held until today made 18% over five years. About 3.3% annually. Their savings account briefly offered better risk-adjusted returns.
But that comparison has a buried assumption: that you bought once, at exactly the worst moment, and never invested another dollar. That's not how pursuing FIRE works.
📉 The Lazy Comparison
Point-to-point price analysis only describes one type of investor: someone who made a single lump-sum purchase on a specific date and held indefinitely. Maybe that describes you. Mostly, it describes nobody in the FIRE community.
What FIRE practitioners actually do is systematic, automated accumulation. A fixed amount — whatever you can commit — invested on a recurring schedule, regardless of what the price is doing. Dollar-cost averaging. Month after month, year after year. You set it up, you forget about it, you keep stacking.
I've written about DCA before and why it's foundational to any FIRE strategy. But this time I want to run the actual numbers with real historical price data, because the math is more interesting — and more powerful — than most people realize.
The experiment: $100 per month, every month, for 60 months. February 2021 through January 2026. Just consistent stacking without timing, panic, or price-watching.
Total invested: $6,000.
🧮 Running the Numbers
Here's what the DCA buyer ended up with, using monthly closing prices from each of those 60 months:
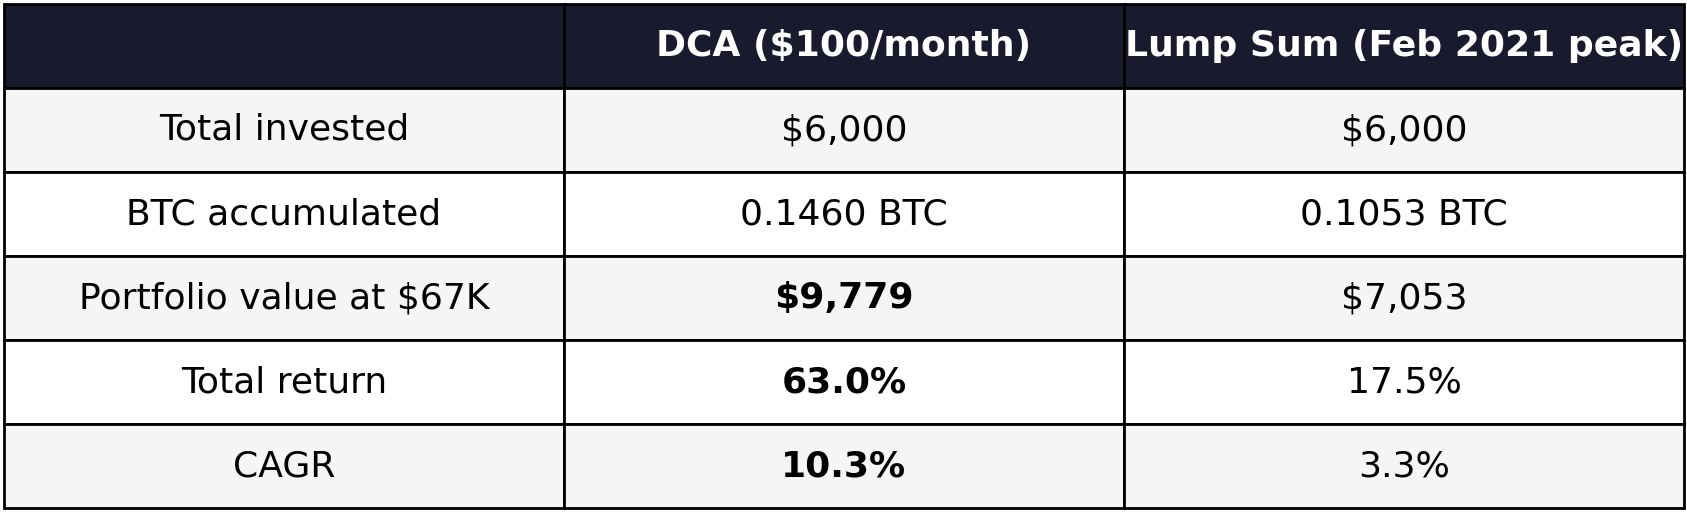
Same starting and ending points, but one investor shows up every month; the other bought once at the peak and held.
The DCA buyer's return is 3.6x higher.
And here's what surprises most people: the DCA buyer's average cost basis is $41,109 per bitcoin — lower than the February 2021 monthly close of $45,138, even though they were still buying through prices as high as $115,000 in July 2025. Every month of buying through the 2022 bear market dragged that cost basis down.
The reader who saw 18% was measuring from the top of a previous cycle to the bottom of a new one. The DCA buyer was measuring something entirely different.
🐻 The Bear Market Gift
2022 was ugly. Bitcoin fell from $43,000 at the start of February to $16,548 by December — a 62% decline over the course of the year. Every month felt like another punch in the gut.
But for the DCA stacker, each of those punches was a buying opportunity.
Here's what $100 bought in the worst months:
Dec 2022 ($16,548): 0.006043 BTC
Nov 2022 ($17,169): 0.005825 BTC
Sep 2022 ($19,432): 0.005146 BTC
Jun 2022 ($19,785): 0.005054 BTC
Compare that to February 2021 at $45,138, where the same $100 bought just 0.002216 BTC. Those bear market months accumulated nearly 3x more bitcoin per dollar than the starting price.
By the end of December 2022, the DCA buyer had invested $2,300 across 23 months and accumulated 0.07266 BTC — a cost basis of $31,654. Well below the starting price. Well below what the lump-sum buyer paid. And sitting on a stack that, when bitcoin eventually recovered, would be priced in at a significant discount.
This is the compounding dynamic of DCA through volatility. You're not just averaging down — you're systematically accumulating more units when prices are suppressed. The months that felt worst were the months that mattered most for the long-term stack.
The FIRE community knows this pattern from decades of stock market investing. Every drawdown — 2001, 2008, 2020 — was a gift to the automated investor. Bitcoin's volatility is more dramatic, but the mechanics are identical. You stay the course. You trust the system. You keep buying.
📊 Above and Below
Here's the clearest way to visualize what those 60 months of DCA actually produced.
